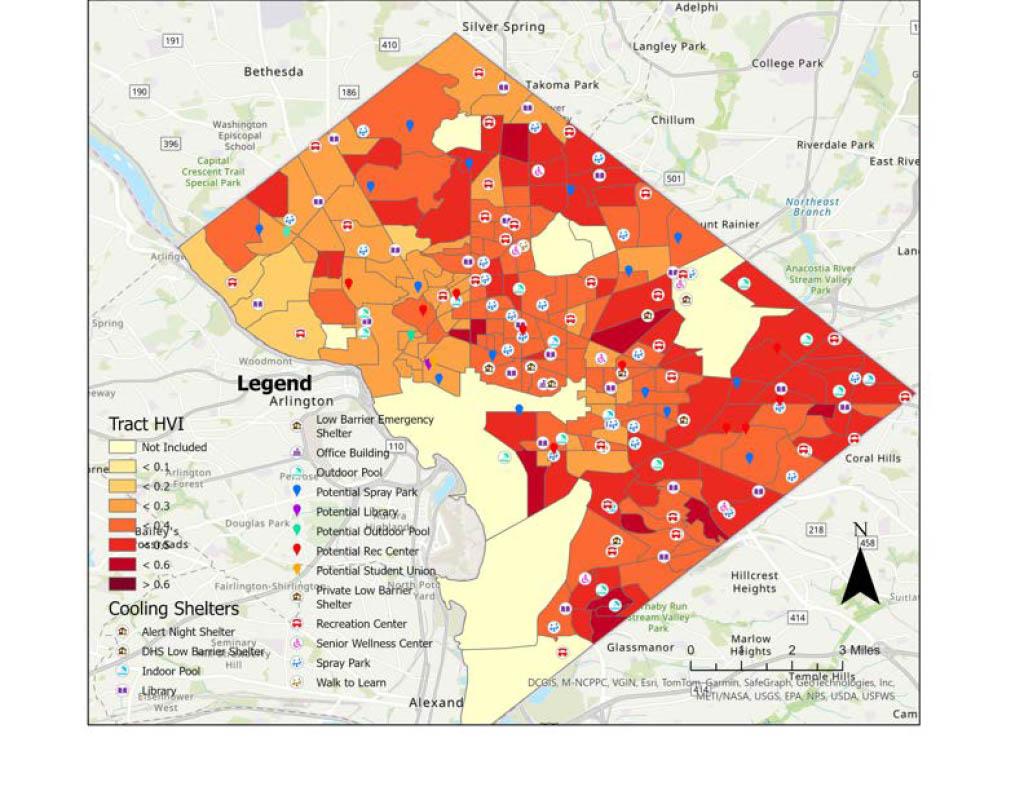
Project Description:
Using data provided by Open Data DC, we created a map that overlaid the locations of current cooling shelters on the census tracts of DC. We also looked at public transportation routes throughout the city, including the metro and bus lines, to ensure accessibility. One way we established accessibility was by prioritizing a maximum walking distance between cooling shelters that does not exceed ¾ of a mile. The tracts were color-coded based on their Heat Vulnerability Index (HVI), which was calculated using equations provided by the Washington DC Department of Energy and Environment. HVI was calculated per tract based on population demographics such as race, income, and health. We also considered the physical characteristics of each tract such as tree cover, ambient air temperature, and especially accessibility to cooling shelters in our calculations. After investigating the tracts with the highest HVI, we identified potential cooling shelter locations and looked at cooling shelters that had improved their cooling facilities beyond their original designation. After optimization, the average HVI for DC was reduced by 11.6 %, from 0.40 to 0.35. Our team also created a community impact assessment to impact how our optimization improved cooling throughout DC.
